APLD Economic Impact Report
The Association of Professional Landscape Designers (APLD) released its Economic Impact Report in October 2016. The report is based on an APLD survey conducted of current APLD members. The purpose of the survey was to assess members’ impact on the economy. Data such as demographic information of members and their employers; members’ certifications and licenses; their revenue sources and project types; and outsourcing to contractors were collected in the 28-question survey. Following are the highlights of the survey results:
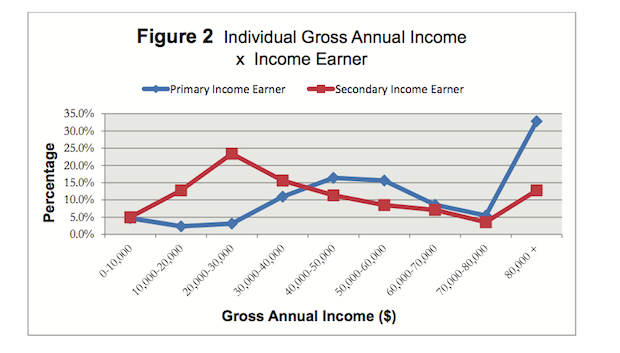
- Nearly half (47%) of APLD members are the primary income earner in the household.
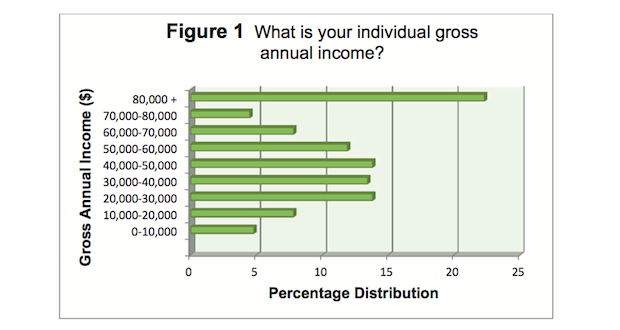
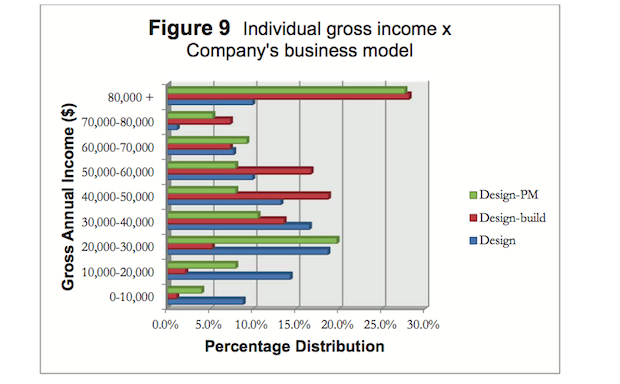
- Nearly 1/4 (22%) of members earn more than $80,000, while another quarter each (27%, 26%) earn $20,000-$40,000 and $40,000-$60,000, respectively.
- Fifty-five percent of respondents practice in the West Census Bureau region.
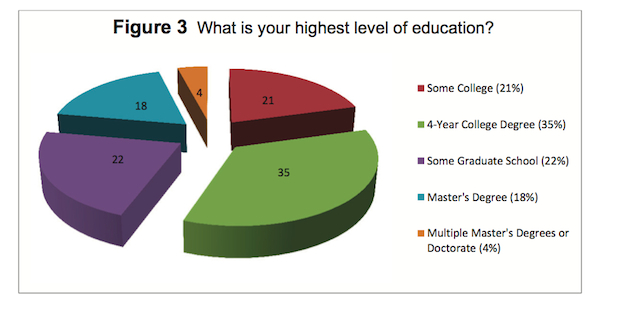
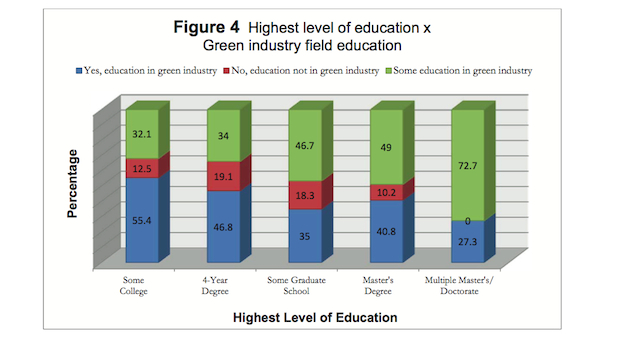
- Nearly half (44%) of APLD members have advanced degrees or have completed some graduate school (see Figure 4).
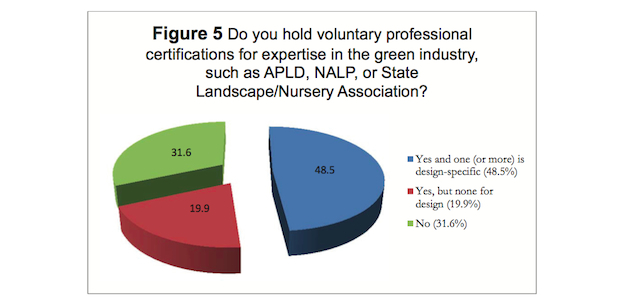
- Nearly 70% of members hold some type of professional certification or license in the green industry. The most common type held is a landscape contractor license (Figure 5).
- Nearly 9 in 10 members solely own or are a partner in their business.
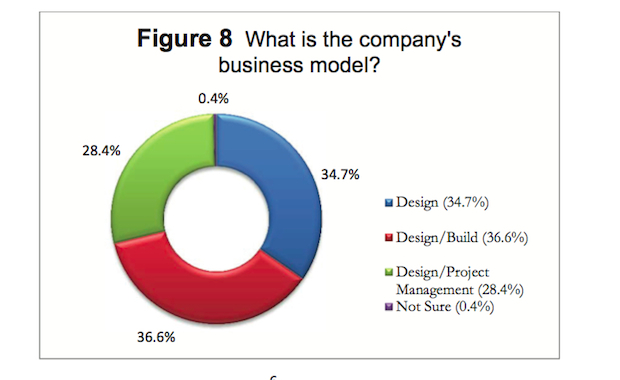
- Thirty-five percent of members’ companies have a design-only model, 37% are design/build, and 28% are design/project management (see Figure 8).
- On average, each company employs six people (1.3 are designers, 3.7 are full time, and 2.4 are part time. In total, respondents reported the employment of nearly 2,600 people.) Extrapolated to the entire membership, APLD members employ about 8,100 people.
- Respondents reported that 12,247 designs were produced annually or nearly 40,000 if this result is extrapolated to all members. No correlation was found between company revenue and number of designs produced.
- More than half of members’ companies utilize other tradespeople in their operations.
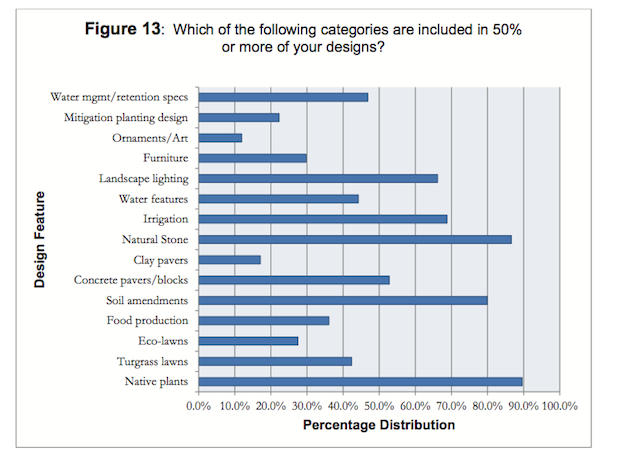
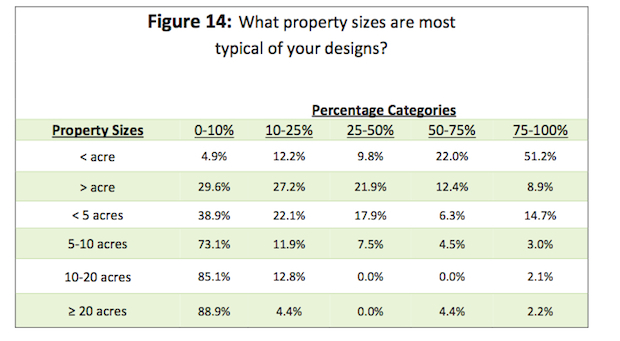
- The most frequently used design features were: native plants (89.6%), natural stone (86.6%), soil amendments (79.9%), and irrigation (68.8%). The least used elements were: Eco-lawns (27.5%), mitigation planting design (22.3%), and clay pavers (17.1%) (see Figure 13).
All charts and graphs provided by The Association of Professional Landscape Designers.